What is Value Stream Mapping?
In Lean thinking, we use Value Stream Mapping (VSM) as a visual tool to identify value for the customer. Its roots trace back to Toyota’s car manufacturing. After World War 2, Japan’s economic situation was uncertain. They needed to be creative to remain competitive. Instead of stockpiling parts, Toyota created a system for only developing parts when needed. Instead of removing defects at the end of a production line, they would be eliminated at each step. Parts would not pass down the line with defects. Lean builds off this and emphasizes the elimination of waste, streamlining of operations, and consistently adding value.
VSM identifies and maps out a process from start to finish. It highlights where value is added in the process. It also helps identify where waste, bottlenecks, information flow, system interactions, and potential for process improvements occur.
Strategic Alignment
A key difference between high level process mapping and value stream mapping is the quantitative aspect. This can be an important early step for data-driven strategic decisions. VSM provides several performance metrics at each step, such as:
- Process Time
- Lead Time
- Completion and Accuracy
Organisations can use this quantifiable data to drive strategy as it provides measurable data for both the current and future state.
Data collection for VSM is dependent on context. Normally, data collection occurs after laying out the activity and functions of a process. Once laid out, ‘walk the flow’ and collect data for each activity. Data collection can occur through:
- Manual Observations
- Recording Times
- Feedback from those involved in the process
Collect additional data through electronic systems or reports for an even deeper understanding of the VSM. This can occur prior to conducting any VSM activities to get a deeper understanding of the scope.
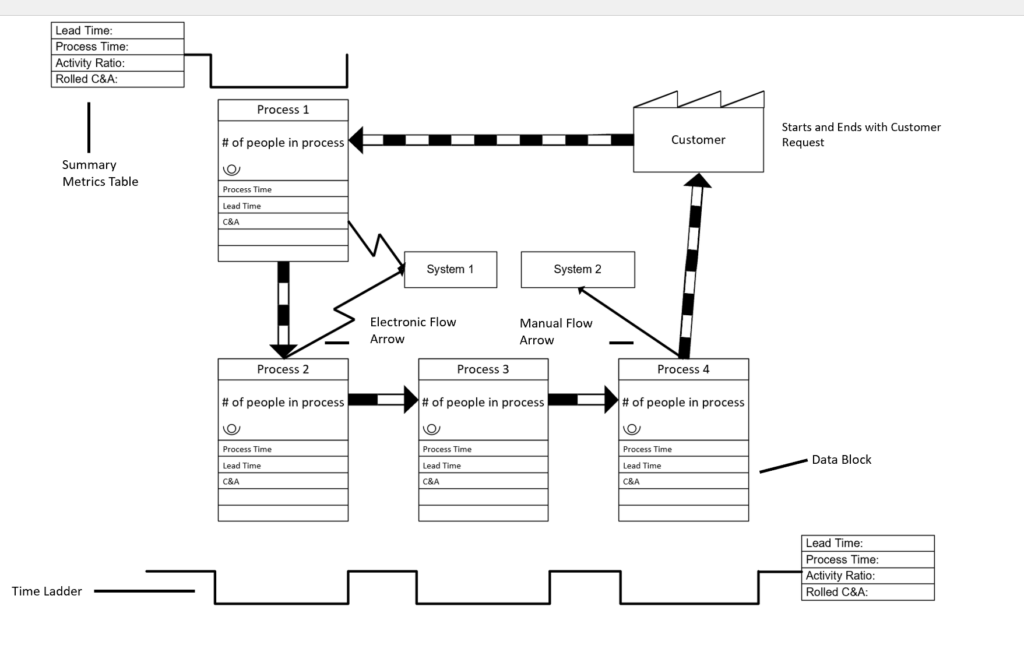
VSM’s also provide a view of information flow across a process. This includes whether the flow is automatic or manual, as well as the number of systems in place to support or hinder the workflow. This enables us to see how the data is being transmitted or stored, how systems interact with each other, and whether there are any technology-related issues. An example of a VSM is shown below:
Team Collaboration in VSM
It is important to realise that VSM is and should not be a data collection exercise. It is easy to exchange emails or have meetings regarding a process. However, this isn’t conducive to building a team around the system. The goal of the VSM isn’t to make the tool. It is to ensure everyone involved at all levels of an organisation understand the customer experience. The tool brings a team together around a particular issue. It prompts discussions, motivates recording observations, and involves gathering verifiable data to incorporate into the process.
Do you need a better understanding of the current state of systems and processes in your organisation? We recently conducted a VSM workshop for a client. We help set performance targets, provided measurable cost and time savings and create an action plan for continued growth and improvement.
Salman Motara, Analyst, Hague Consulting Ltd. © Hague Consulting Ltd 2023
Share this on social media